On June 15, 2026, EPSS v5 replaced v4 in the production data feed. The endpoint did not change. The CSV schema did not change. Integrations could continue running without a technical migration.
That quiet compatibility was the governance problem.
A consuming system can remain healthy while the decisions it produces change materially. Fixed thresholds can send thousands of CVEs into or out of remediation queues. Executive trends can break overnight. Service-level commitments and staffing assumptions can shift even though nobody changed a policy, an asset, or a control.
The leadership question was never simply, “Did our EPSS integration keep working?” It was, “Do the decisions built on EPSS still mean what we think they mean?”
The decision: treat model changes as production changes
EPSS estimates the probability that exploitation activity for a CVE will be observed in the next 30 days. FIRST publishes the score and its percentile daily. Those signals are useful for prioritization, but they are neither a universal patching policy nor a substitute for exposure, business consequence, compensating controls, or known exploitation.
FIRST says there is no universal EPSS threshold. Each organization must select an approach that reflects its objectives, risk tolerance, and remediation capacity. Once an enterprise embeds a selected threshold in automation, however, the model becomes part of a production decision system.
That system includes more than an API call:
- ticket creation and due-date rules;
- vulnerability tiers and escalation paths;
- exception and risk-acceptance workflows;
- remediation forecasts and staffing assumptions;
- key risk indicators reported to executives or boards; and
- historical measures used to claim improvement.
Changing the model can change every one of those outputs. A stable interface only proves that data continued to flow.
What changed underneath EPSS v5
FIRST described v5 as a model refresh prompted by gradual performance degradation, with changes that included updated GitHub exploit detection, improved calibration, VulnCheck KEV data, GitHub Popularity Metrics, and other model refinements. The production model identifier changed from v2025.03.14 to v2026.06.15 at cutover.
The history matters. FIRST’s production data page records these recent boundaries:
| Version | First production score date | Time since prior major version |
|---|---|---|
| EPSS v3 | March 7, 2023 | — |
| EPSS v4 | March 17, 2025 | Just over two years |
| EPSS v5 | June 15, 2026 | About fifteen months |
This was not a cadence of new major versions every few months. It was also not a one-time event. FIRST’s FAQ explains that updates are driven by observed model performance rather than a fixed calendar and have occurred approximately annually in practice. Enterprises should therefore build a repeatable control for the next transition instead of treating each release as an exception.
The EPSS v4 retrospective explains why reporting has to preserve the model boundary. Operationalizing EPSS covers the separate question of how probability fits with exposure, business consequence, and other decision signals.
Evidence: how much the threshold populations moved
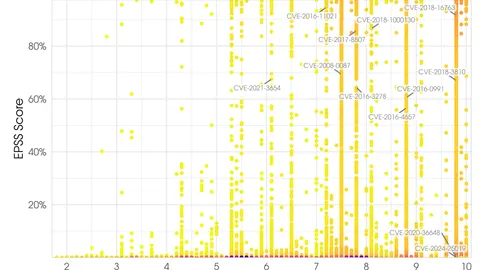
I compared the last v4 production snapshot from June 14 with the first v5 production snapshot from June 15. The files came from the official EPSS score archive that FIRST links from its data page. To avoid treating newly added or removed records as model movement, the calculation includes only the 340,204 CVEs present in both files.
These thresholds are illustrations, not recommendations from FIRST.
| EPSS threshold | v4 CVEs | v5 CVEs | Net change | Crossed up | Crossed down |
|---|---|---|---|---|---|
| ≥1% | 76,822 | 142,535 | +85.5% | 71,776 | 6,063 |
| ≥5% | 34,247 | 30,306 | −11.5% | 7,619 | 11,560 |
| ≥10% | 23,068 | 17,041 | −26.1% | 3,820 | 9,847 |
| ≥50% | 7,193 | 4,249 | −40.9% | 1,011 | 3,955 |
| ≥90% | 1,363 | 758 | −44.4% | 188 | 793 |
The results are counterintuitive in a useful way. The population at or above 1% nearly doubled, while populations at the higher illustrative thresholds fell. This was not a uniform inflation or deflation of scores. It was a redistribution.
That distinction changes how leaders should read the numbers. A lower count above 50% may reduce the apparent “critical” queue while the much larger population above 1% broadens the set requiring contextual analysis. Neither result is inherently better. The value depends on whether the program combines likelihood with reachable assets, service importance, control coverage, and the consequences of delay. A queue that becomes smaller but misses consequential exposure is not an improvement; a queue that becomes larger than teams can investigate may simply create more aging work.
The crossing counts are operationally more revealing than the net totals. At the 5% line, for example, 7,619 shared CVEs crossed upward while 11,560 crossed downward. A dashboard showing only a net reduction of 3,941 would conceal more than 19,000 individual priority changes.
I also tested the June 8 v4 production file against the publicly available June 8 v5 beta file. That same-date preview showed the same practical pattern: +85.6% at 1%, −11.5% at 5%, −26.1% at 10%, −41.0% at 50%, and −44.2% at 90%. The beta’s model identifier was v2026.05.12, so it was not the final production build, but the close agreement supports the conclusion that the discontinuity was primarily a model effect rather than an ordinary day of threat-signal movement.
The production comparison still has an important limitation: consecutive daily files combine the model transition with one normal day of data and population change. Restricting the analysis to shared CVEs reduces that problem but does not create a perfect counterfactual. The source snapshots, hashes, script, and generated results are retained with the private research record so the calculation can be rerun.
The leadership lessons
A successful API call is not a successful change
Technical monitoring will tell you whether the feed arrived and the parser succeeded. It will not tell you whether remediation demand doubled at one threshold, whether an aging KRI became discontinuous, or whether exceptions now fall into a different tier.
Model consumers need semantic tests alongside availability tests. Before cutover, run the candidate scores through the actual policy and compare resulting actions—not merely the raw scores.
This is especially important when EPSS is hidden behind a commercial platform. The consuming organization still owns the decision, even if a vendor retrieves the data, converts it into a proprietary priority, or changes the score without exposing the model boundary. Contracts and operating procedures should require enough lineage to determine which EPSS version informed a recommendation and when the provider adopted it.
A threshold is a capacity and risk decision
A fixed numerical threshold often looks objective. In practice, it encodes a compromise among threat coverage, business consequence, operational capacity, and risk tolerance. When calibration changes, the same number may represent a different workload and a different selection of vulnerabilities.
If a new model changes the queue substantially, quietly adjusting the threshold until the old volume returns is not neutral. It is a new prioritization decision and should have an owner, rationale, and approval.
The better question is not, “Which threshold restores our old ticket count?” It is, “Which decision rule produces acceptable threat coverage for the exposures that matter, within a capacity model we can sustain?” That may lead to different thresholds by asset class, or to a multi-signal policy using KEV status, reachability, business impact, and control evidence. Whatever the answer, it should be tested against outcomes rather than chosen to make a dashboard look stable.
Net counts hide operational churn
Leaders need both the aggregate effect and the bidirectional movement. A modest net change can mask thousands of CVEs crossing in opposite directions, each potentially changing an owner, due date, exception, or escalation.
Impact analysis should show at least:
- counts crossing each production threshold in both directions;
- changes by business service, owner, exposure, and consequence;
- effects on open tickets, due dates, exceptions, and SLA breaches;
- the capacity required to absorb newly prioritized work; and
- high-consequence assets that moved down as well as those that moved up.
Sampling both directions matters. Upward movement tests whether additional work is justified and actionable. Downward movement tests whether a model change could relax attention on an exposed service whose consequence, active exploitation evidence, or control weakness still warrants urgency. EPSS informs the likelihood component of a decision; it does not revoke the rest of the risk context when its score falls.
Model boundaries must remain visible in executive reporting
An EPSS-based KRI before June 15 and the same KRI after June 15 may not be directly comparable. A falling count above a threshold does not, by itself, show improved security. An increasing count does not, by itself, show deteriorating control performance.
Retain the score date and model version with every decision record. Mark version boundaries on trend charts. Where continuity matters, show parallel baselines or rebaseline with an explicit governance note rather than silently splicing unlike measures together.
What should change before the next version
FIRST made v5 beta score files publicly observable by May 22, 24 calendar days before production cutover. I did not find a dated, pre-cutover FIRST announcement that promised the exact production date; the formal FIRST release page I found was published after the transition. That makes continuous monitoring of official data and release channels more important than waiting for an integration failure or vendor notice.
An organization that relies on EPSS should keep a standing transition playbook:
- Maintain an owner and dependency inventory. Know every control, dashboard, ticket rule, data product, and third party that consumes score, percentile, or model-derived tiers.
- Detect model identifiers. Parse and retain the model version from the CSV metadata. Alert when it changes.
- Acquire preview data. When a beta or candidate dataset appears, preserve it and run it in parallel against the current production model.
- Measure decision impact. Compare resulting tickets, tiers, owners, due dates, exceptions, KRIs, and remediation demand—not just score distributions.
- Test consequential movements. Review upward and downward changes for internet-exposed and high-impact services. Confirm that KEV, asset context, and compensating controls still operate as intended.
- Approve policy changes. Route material changes in thresholds, capacity, or risk acceptance through the accountable risk owner.
- Plan the reporting boundary. Annotate the model transition and establish how historical comparisons will be presented.
- Verify after cutover. Reconcile record counts, version metadata, queue volumes, automation outcomes, aged work, exceptions, and samples of high-consequence assets.
This control should not depend on knowing whether the next update arrives in twelve months or twenty-four. It should be ready whenever evidence of drift leads FIRST to refresh the model.
How to verify improvement
I would not judge the transition by how closely the new queue resembles the old one. I would judge it by whether the organization can explain the changed decisions and show that the resulting work still addresses the exposures that matter.
Useful verification measures include:
- percentage of EPSS-informed decisions retaining score date and model version;
- time from candidate-data availability to completed impact assessment;
- number of production dependencies covered by parallel testing;
- unexplained threshold crossings or automation changes after cutover;
- remediation demand compared with available capacity by service owner;
- coverage of exploited, exposed, and high-consequence vulnerabilities; and
- executive reports with an explicit version-boundary annotation.
EPSS is one example of a wider issue. Predictive models are living parts of enterprise controls. The interface can stay stable while the meaning changes, and security leadership has to govern both sides of that boundary.
What did your organization have to rebaseline after testing EPSS v5 against its remediation thresholds, capacity assumptions, and executive KRIs?